Tips and Best Practices for Metabolite Detection in 3D Cell Cultures
Promega Corporation
Publication date: October 2025
Introduction
Accurate measurement of phenotype is central to understanding how cells function and respond to their environment. This is particularly true for three-dimensional (3D) models such as spheroids and organoids, which provide greater physiological relevance than traditional monolayer cultures while also introducing additional complexity. Careful monitoring of cell health and metabolism is essential to generate phenotypic readouts that are both meaningful and reproducible.
This guide highlights practical considerations, tips, and case studies for using Promega’s bioluminescent metabolite assays with 3D models, helping researchers design experiments with confidence.
Promega is a leader in 3D assay solutions. Whether it be viability, cytotoxicity, or metabolite detection, Promega offers powerful and sensitive tools for your research needs. For more information about 3D models and their applications, visit our 3D Cell Culture Guide.
Explore the complete list of Promega's 3D compatible assays.
Promega Bioluminescent Metabolite Assays

For researchers working with 3D models, this format offers distinct advantages:
- High sensitivity and broad dynamic range. Detection spans femtomole levels to millimolar concentrations, capturing subtle changes in small sample volumes.
- Wide assay window. Light output exceeds background by more than 100-fold, providing confidence in distinguishing true biological effects.
- Simple workflow. An add-and-read format minimizes handling, reduces variability, and works seamlessly with standard plate readers (Figure 2).
View a complete list of Promega Metabolic activity assays.

Choosing the Right Media for 3D Metabolite Assays
Nutrient concentrations matter
Serum choice impacts sensitivity
Stay within the assay’s linear range
Best practices when selecting media for subsequent metabolite assay measurement
- Choose physiologically relevant baseline concentrations when possible (e.g., 5 mM glucose).
- Use dialyzed serum to minimize background metabolite noise.
- Record and report exact media formulations for reproducibility.
- Dilute culture supernatants to bring metabolite concentrations into the assay’s linear range.
Practical Considerations for Spheroid Handling
3D Cell Models Sensitive to Media Removal
Partial Media Exchange Balances Data Quality with Spheroid Integrity
Best Practices for Medium Exchange in Spheroid Assays
- Instead of fully removing culture medium, replace only ~50% of the volume to preserve spheroid integrity while still providing fresh nutrients or drug exposure.
- Partial exchange leaves higher baseline metabolite levels, which can reduce sensitivity for detecting small changes.
- Media-only and time-zero controls are essential to distinguish treatment effects from baseline metabolite accumulation.
Case Study: Monitoring metabolite consumption and secretion in 3D Models
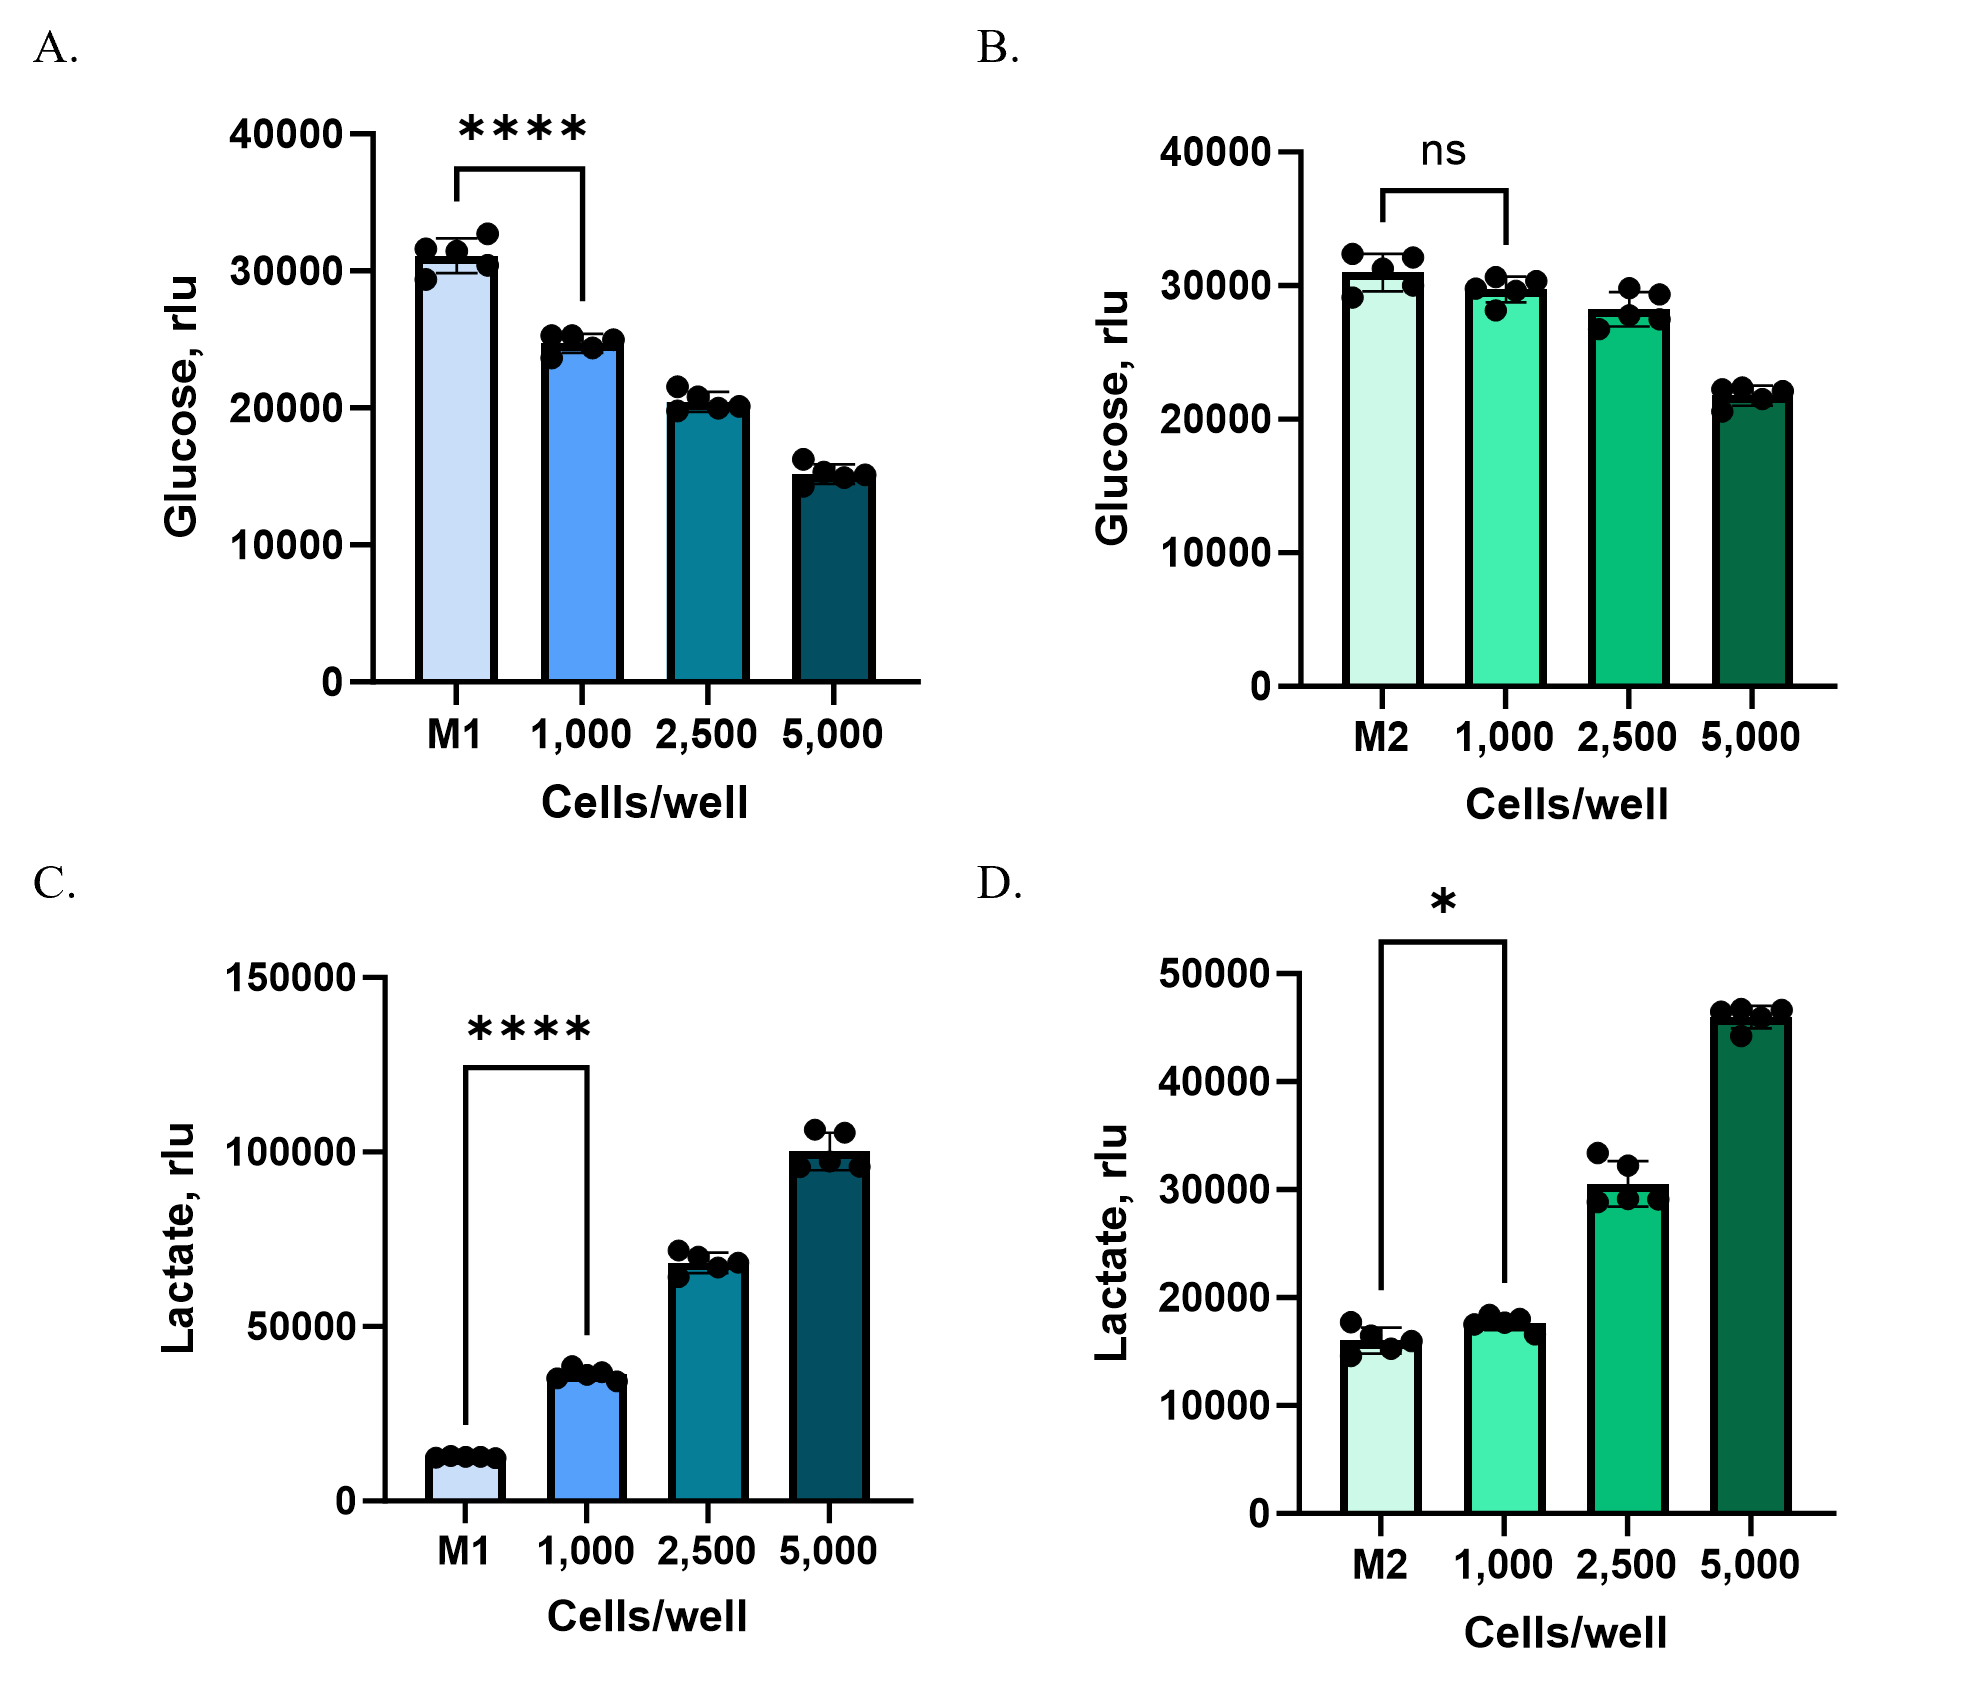
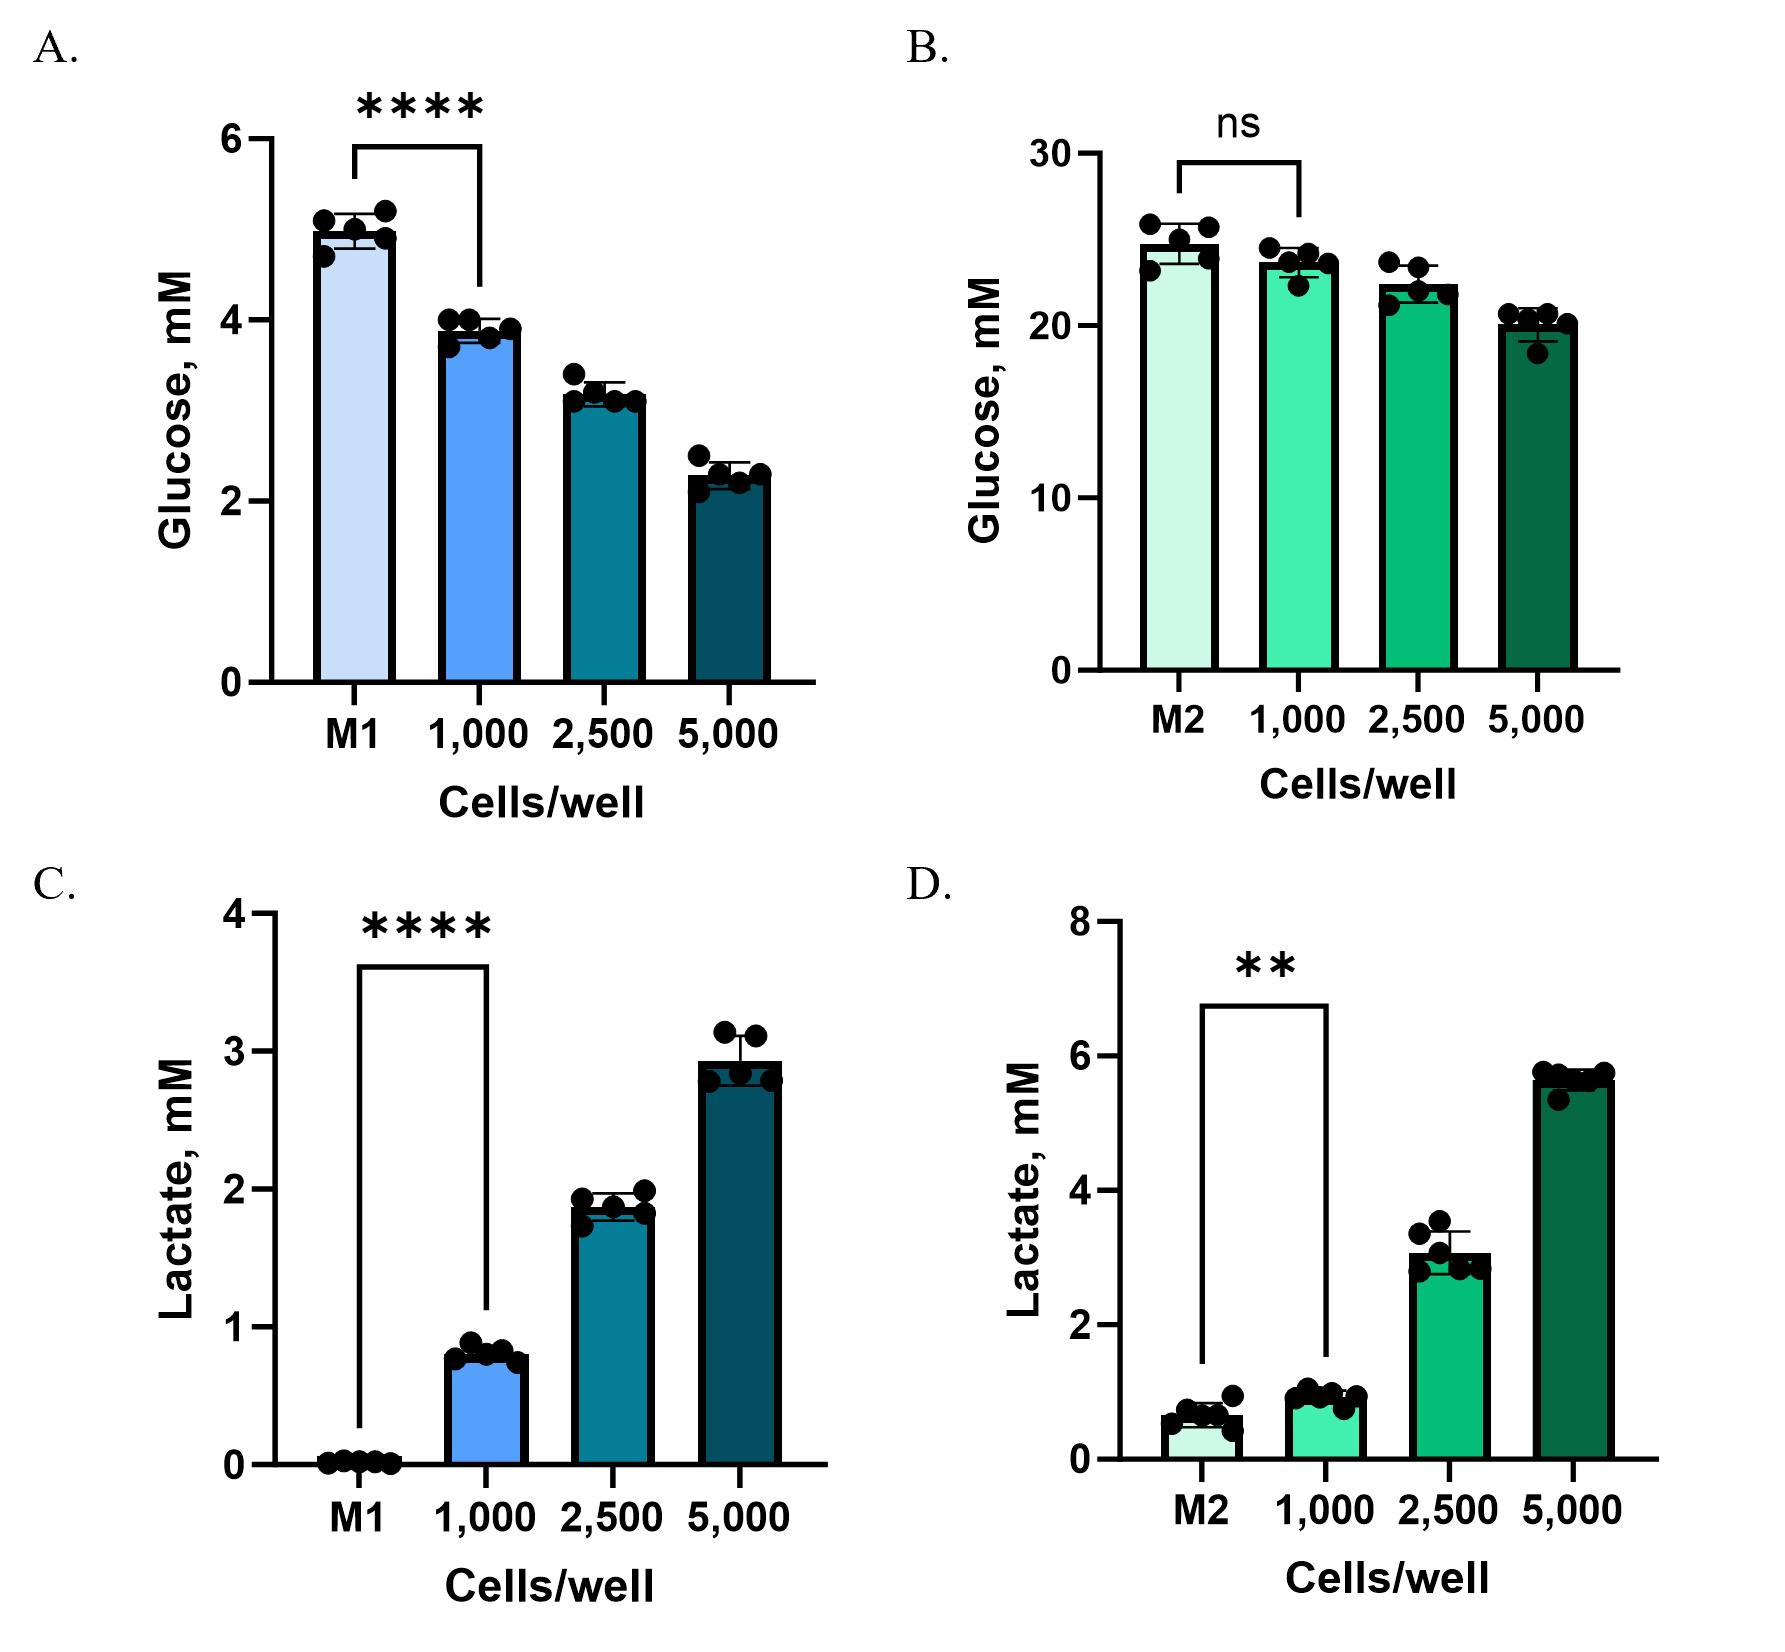
To illustrate how medium composition and cell density shape assay outcomes, we compared glucose consumption and lactate secretion in HCT116 spheroids grown under two media conditions:
- M1: DMEM with 5 mM glucose and 5% dialyzed serum
- M2: DMEM with 25 mM glucose and 10% FBS
HCT116 cells were plated at different starting densities (1,000, 2,500, or 5,000 cells per well) in Ultra-Low Attachment plates to enable spheroid formation. After 72 hours, culture supernatants were collected from each well and analyzed using the Glucose-Glo™ Assay and Lactate-Glo™ Assay. Because baseline glucose concentrations in M2 medium were substantially higher than in M1, samples were diluted 800-fold (M2) or 160-fold (M1) with PBS to bring metabolite levels into the linear detection range of the assays.
At higher cell densities (2,500 and 5,000 cells/well), both M1 and M2 media revealed clear shifts in glucose consumption and lactate production compared to controls (Figure 3). At the lowest density (1,000 cells/well), however, changes were detectable only in M1. The lower baseline glucose concentration and reduced background metabolites in M1 created a more sensitive assay window, allowing subtle changes to be measured that were masked in M2.
Case Study: Utilizing Metabolite Assays for Inhibitor Screens using 3D Models
Promega’s add-and-read bioluminescent metabolite assays are well-suited for automated and high-throughput workflows. Their sensitivity allows miniaturization to 384- or even 1536-well formats, making them effective tools for high-throughput metabolic screening in complex 3D models. To demonstrate this, we applied the assays in a focused inhibitor study using media collected from spheroids.
We selected two well-characterized metabolic pathway inhibitors to apply to the HCT116 spheroids. The glycolysis inhibitor 2-deoxy-D-glucose (2DG), a nonhydrolyzable glucose analog, was used to block lactate production, measured with the Lactate-Glo™ Assay in 384-well format. The glutaminase inhibitor BPTES, which prevents conversion of glutamine to glutamate, was used to block glutaminolysis, with changes measured by the Glutamate-Glo™ Assay, also in 384-well.
At the start of treatment (“0h”), lactate and glutamate levels in spheroid wells were already higher than media-only controls, reflecting secretion during spheroid formation and the use of a partial (50%) medium exchange strategy. Over 24 hours of treatment, untreated spheroids continued to secrete metabolites: lactate levels rose by ~200% (an increase of ~1.4 mM) and glutamate by ~170% (an increase of ~46 µM) (Figure 5A,B). In contrast, 2DG treatment nearly abolished lactate secretion (>90% inhibition), while BPTES reduced glutamate secretion by ~65–70% (Figure 5C,D).
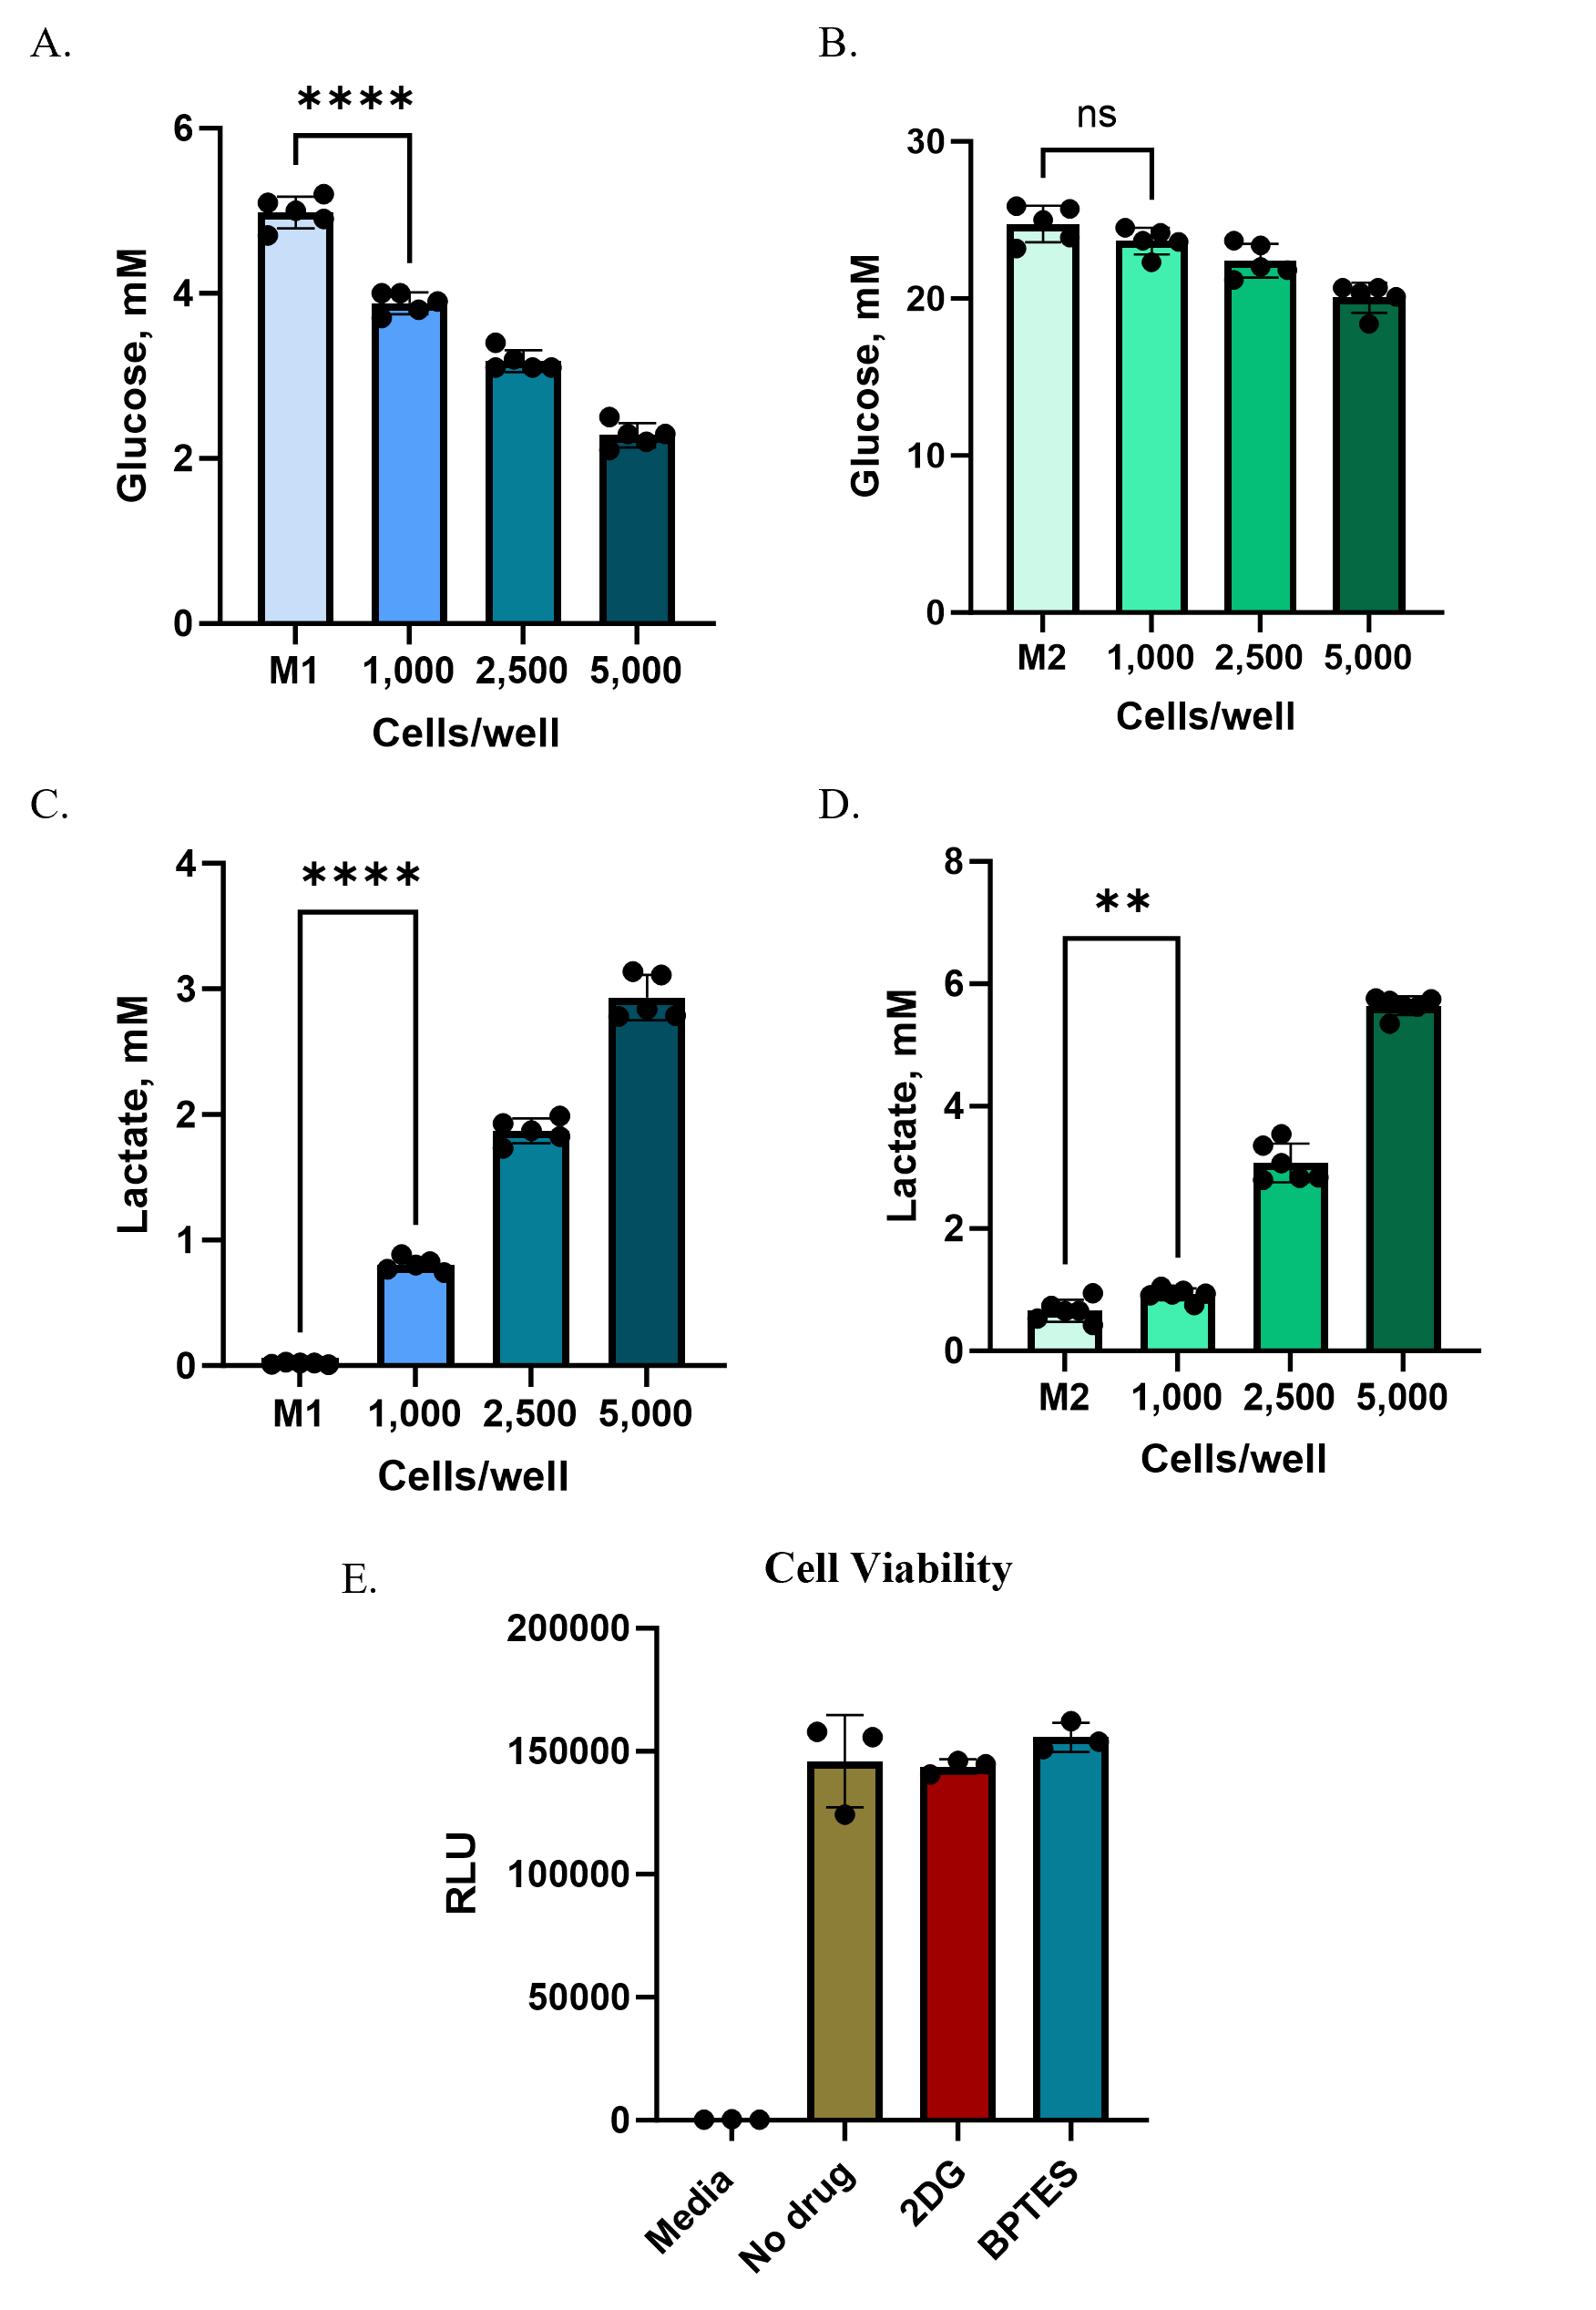
To confirm that changes in metabolite levels reflected pathway inhibition rather than cytotoxicity, we measured viability using the RealTime-Glo™ MT Cell Viability Assay. Luminescent signals from treated spheroids were comparable to untreated controls, demonstrating that 2DG and BPTES were not toxic under these conditions (Figure 5E).
These results show that Promega’s metabolite assays can be effectively applied to inhibitor testing in 3D spheroids in a miniaturized format, enabling robust detection of pathway-specific effects while maintaining compatibility with automation and high-throughput workflows.
Keys for Success in Measuring Metabolites in 3D Models
Promega’s luminescent metabolite assays provide a sensitive and versatile platform for monitoring metabolic activity in 3D cell models. By coupling metabolite-specific dehydrogenases with NAD(P)H-dependent bioluminescence, these assays deliver femtomole-level sensitivity, a wide linear range, and a robust assay window. To maximize their impact in spheroid and organoid studies, researchers should keep the following factors in mind:
- Optimize medium composition. Select physiologically relevant nutrient levels (e.g., low glucose) and use dialyzed serum to minimize background metabolites that mask subtle changes. Aligning culture conditions with experimental goals increases both sensitivity and biological relevance.
- Consider cell density effects. Low-density spheroids are more amenable to detecting subtle changes, while higher densities may require nutrient-rich media to maintain steady metabolic activity. Pilot experiments at multiple densities can help identify optimal conditions.
- Use partial medium exchange for handling. Replacing ~50% of the medium preserves spheroid integrity and reduces well-to-well variability. While this reduces assay sensitivity, it provides a reproducible and automation-friendly workflow.
- Pair metabolite assays with viability measurements. Running assays such as RealTime-Glo™ MT Cell Viability in parallel ensures that observed changes reflect pathway modulation, not cytotoxicity.
- Leverage scalability for efficient high-throughput studies. The add-and-read format and luminescent readout make these assays highly compatible with 384- and 1536-well formats, supporting efficient inhibitor screens and other high-throughput applications.
Learn More
Related Resources

Assays and Tools to Monitor Biology in 3D Cell Cultures
We offer assays and tools to address each step in your workflow, from cell health and metabolic changes to gene expression and analysis.
Article: Metabolic Profiling of 3D Brain Organoids Using Bioluminescence-Based Assays
Read how Promega assays can measure metabolic readouts from cortical brain organoids.